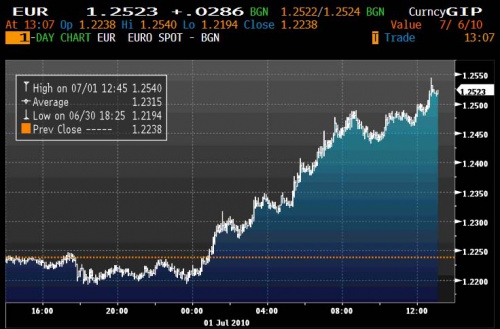
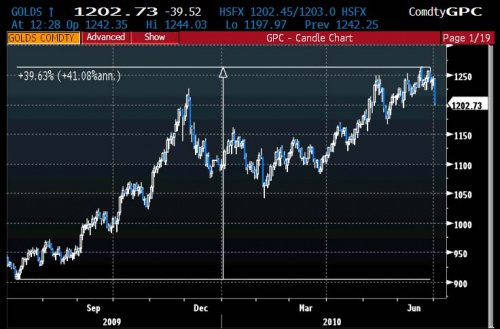
A prima vista, il recupero violentissimo da short covering dell’€ potrebbe essere interpretato come una situazione migliore del previsto in Europa, soprattutto se visto insieme al collasso del Gold :
Alla fine dei conti, invece, la situazione è ben diversa, invece : è una crisi di liquidità improvvisa del sistema.
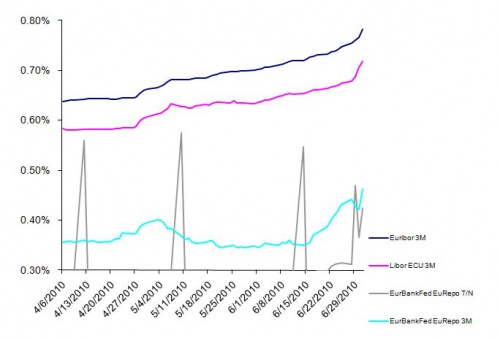
Ecco un grafico infatti illuminante :
La spiegazione ?
Eccola, al solito cortesemente offerta da Zerohedge :
In dark blue is 3 month cost of euros in Europe in the interbank market (euribor), in purple is cost of USD in Europe (euro libor), and in light blue is 3mth repo in europe. This chart speaks for itself.
I may be reading into this too much, but that slight dip in the repo line (light blue) in the end of June could be the quarter-end games played among banks who window-dressed their balance sheets for quarter-end and therefore had less of a need to borrow cash by posting treasuries as collateral across the June 30 “window.”
Now it’s July 1 and the repo rate has snapped higher by just over 4bps to 0.46% – a new 12 mth high.
Of course, the recent acceleration in the rise in Euribor and Euro Libor is also scary, and tells you that banks are really pulling in their horns on each other and continuing to ‘hunker down’ — of course, why shouldn’t they when nobody knows whether the counterparty has cancer or is just fine ?
A lender trying to determine an appropriate rate of interest when such binary scenarios/thinking are so well defined is incentivized to just say no, right ?
I don’t amaze much, but it amazes me that we watched this exact reel here 2 years ago and investors still talk about TED spreads or Libor-OIS… talk about generals analyzing the last war.
It does NOT surprise me that the press was trying to put a nice face on the lower-than-expected 3mth facility uptake yesterday as the LTRO rolls off. I say: WHO CARES? The real story is the complete collapse in confidence among “highly interconnected banks” who now wish they weren’t so connected!
D’altra parte, è evidente che tutti i movimenti visti ieri non sono altro che prese di beneficio dovute al fatto che c’è bisogno di fare cassa – e velocemente – per reintegrare i margini.
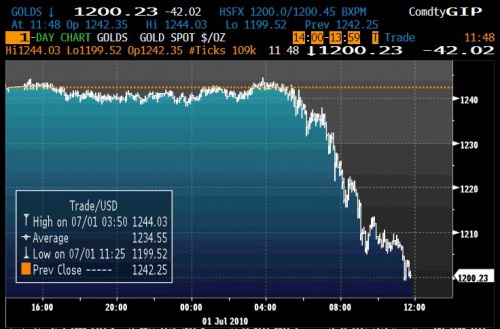
In un certo senso, viene buttato via il bimbo con l’acqua sporca ,ecco ad esempio il perchè del collasso del Gold, che non è certo dovuto a questioni fondamentali.
La violenza del movimento sul Gold però a questo punto lascia propendere per una continuazione nei prossimi giorni della correzione, il grafico di lungo periodo parla da solo.
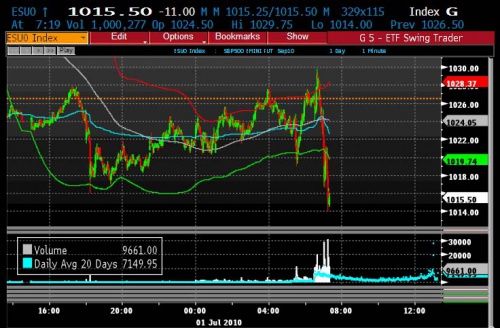
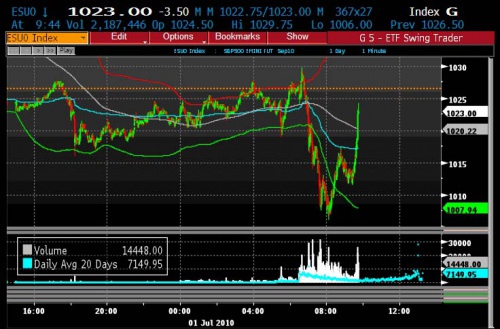
Mentre l’andamento dello Spoore di ieri mostra che ad un certo punto c’è stato l’intervento del PPT :